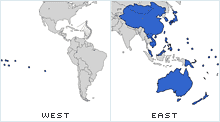
This map is an approximation of actual country borders.
Average 2002-2011 (no 2009) seasonal influenza-associated excess mortality (numbers, rates per 100 000), by age group and WHO region
|
WHO region |
Influenza-associated respiratory mortality estimates: numbers |
Influenza-associated respiratory mortality estimates: rates per
100 000 |
||||||
|---|---|---|---|---|---|---|---|---|
|
Number, under 65 (range) |
Number, 65+ (range) |
Number, all ages (range) |
Number of cases aged 65+ as
percent of Total (range) |
Geographical distribution of
total (%) |
Rates, under 65 (range) |
Rates, 65+ (range) |
Rates, all ages (range) |
|
|
Sub-Saharan Africa |
27 530 (17 752-41 686) |
15 565 (9446-21 079) |
43 096 (31 312-62 765) |
36% (28%-43%) |
11% |
3.7 (2.3-5.9) |
65.0 (34.8-92.9) |
5.6 (3.7-8.6) |
|
Americas |
13 743 (6802-22 175) |
41 498 (17 572-66 604) |
55 241 (26 707-88 779) |
75% (63%-80%) |
14% |
1.7 (0.8-2.8) |
54.9 (20.7-91.2) |
6.2 (2.8-10.1) |
|
Eastern Mediterranean |
10 987 (8493-13 739) |
12 732 (10 485-15 823) |
23 719 (18 988-28 033) |
54% (49%-57%) |
6% |
2.2 (1.7-2.8) |
57.6 (43.6-77.1) |
4.5 (3.5-5.6) |
|
Europe |
7687 (6568-9383) |
39 064 (24 992-50 760) |
46 751 (34 375-58 761) |
84% (70%-86%) |
12% |
1.0 (0.9-1.2) |
30.9 (19.1-40.8) |
5.3 (3.8-6.7) |
|
South-East Asia |
39 747 (27 649-57 319) |
62 665 (25 754-91 392) |
101 411 (53 403-133 228) |
61% (46%-69%) |
26% |
2.4 (1.7-3.6) |
70.3 (33.7-103.2) |
5.8 (3.3-7.6) |
|
Western Pacific |
26 031 (16 491-39 293) |
63 605 (42 116-85 003) |
89 637 (63 495-115 419) |
71% (61%-79%) |
23% |
1.6 (1.0-2.5) |
43.4 (29.6-55.3) |
5.1 (3.7-6.1) |
| World | 128 512 (91 764-184 980) | 260 701 (187 430-333 250) | 389 213 (293 980-518 230) | 67% (60%-72%) | 100% | 2.1 (1.6-3.1) | 53.7 (35.6-71.7) | 5.9 (4.0-8.0) |
WHO – World Health Organization table src src
So Asia and Pacific including Oceania and Japan accounts for half of the seasonal influenza cases. But in terms of rate, there is difference but not large. Eastern Mediterranean is the lowest: 4.5 while Americas is the highest 6.2. The rate in SE Asia (5.8) is higher than that in Western Pacific (5.1). But when we focus on the elder group, the picture is different.
